Visualize Xtrace for Agent
An intra-kernel trace dumps to two report forms. The HTML report is interactive
and meant for people. The JSON report is machine-readable. To let a coding agent
read a trace, G-Watch renders that JSON report as compact text with gwatch show.
gwatch show
gwatch show reads a Section_IntraKernelTrace JSON report (the file produced by
report.render("trace.json")) and prints pipeline analysis to the terminal. An
agent reads this text directly.
gwatch show trace.json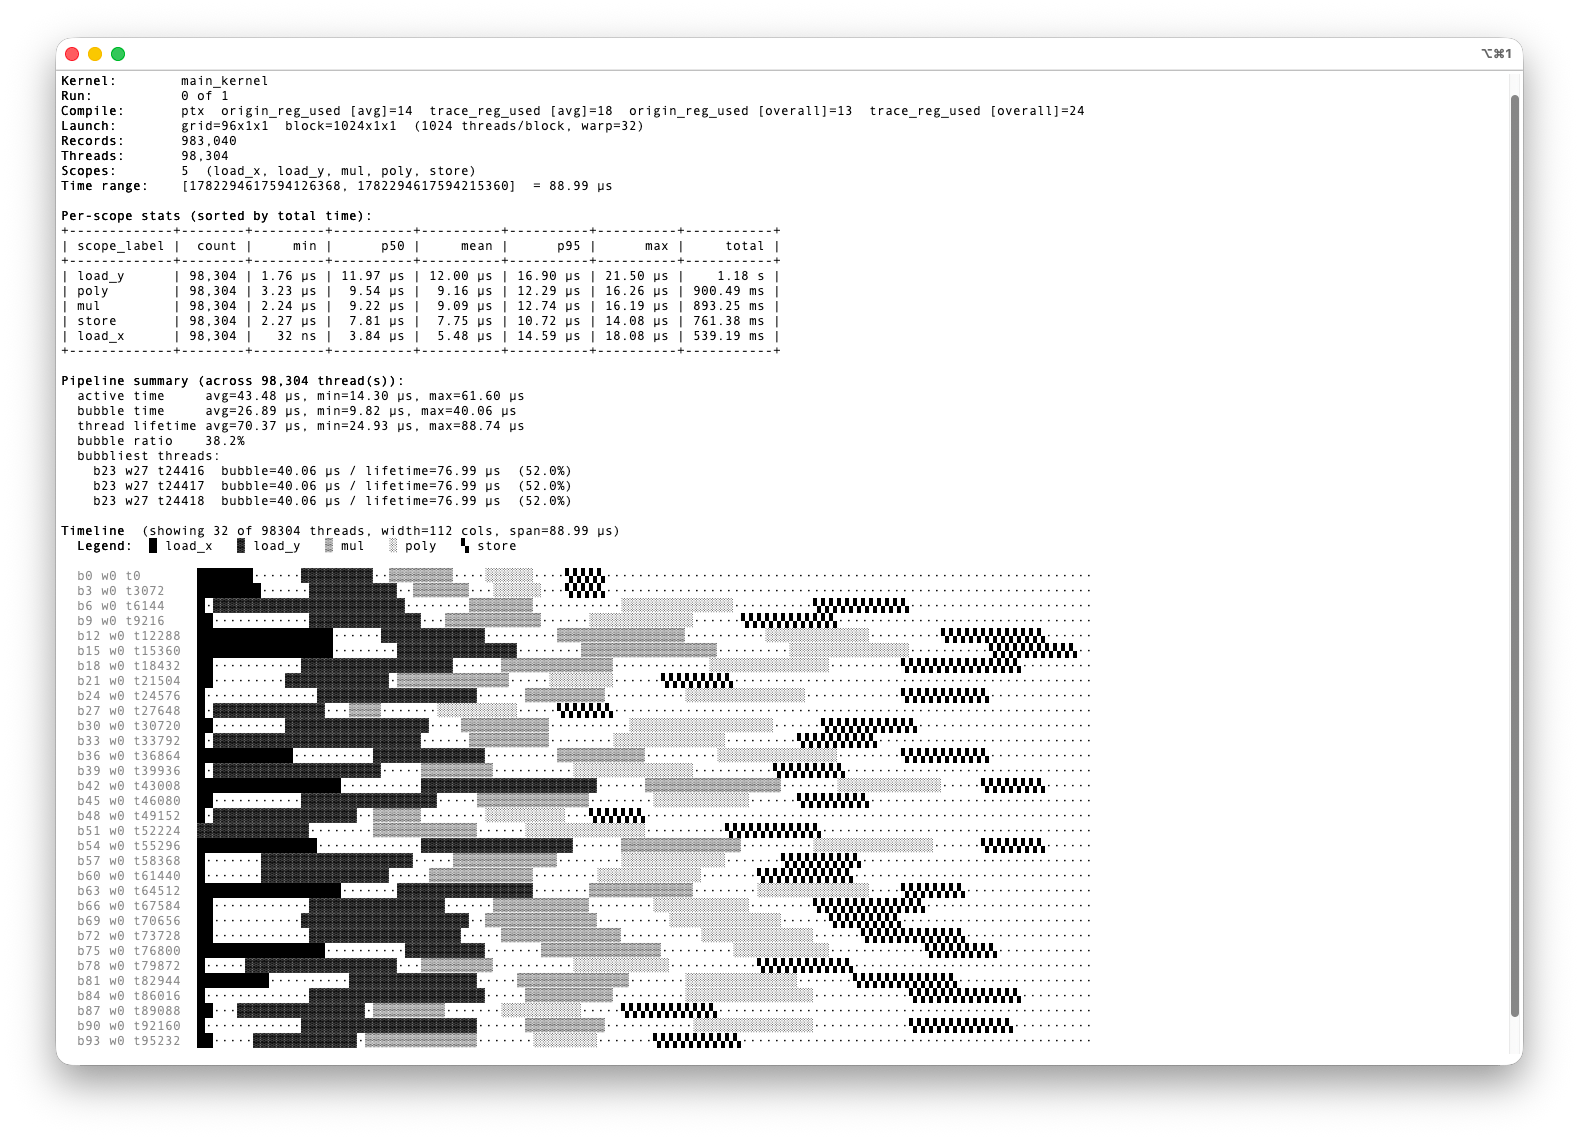
By default it prints:
- A header: kernel, launch dimensions, record and thread counts, scopes, and time span.
- Per-scope stats: count and min, p50, mean, p95, max, and total time per scope.
- A pipeline summary: per-thread active vs. bubble time, bubble ratio, and the bubbliest threads.
- A per-thread ASCII timeline (Gantt) with a scope legend.
Focused views and structured output
Flags select a single view:
gwatch show trace.json --stats         # per-scope stats only
gwatch show trace.json --bubbles       # pipeline summary + longest bubbles
gwatch show trace.json --timeline      # per-thread ASCII timeline
gwatch show trace.json --concurrency   # active-threads-over-time histogram
gwatch show trace.json --outliers      # straggler threads
For programmatic consumption, --json emits the full analysis as structured JSON:
gwatch show trace.json --json