Xtrace
Agent skill: /gwatch_cuda_xtrace
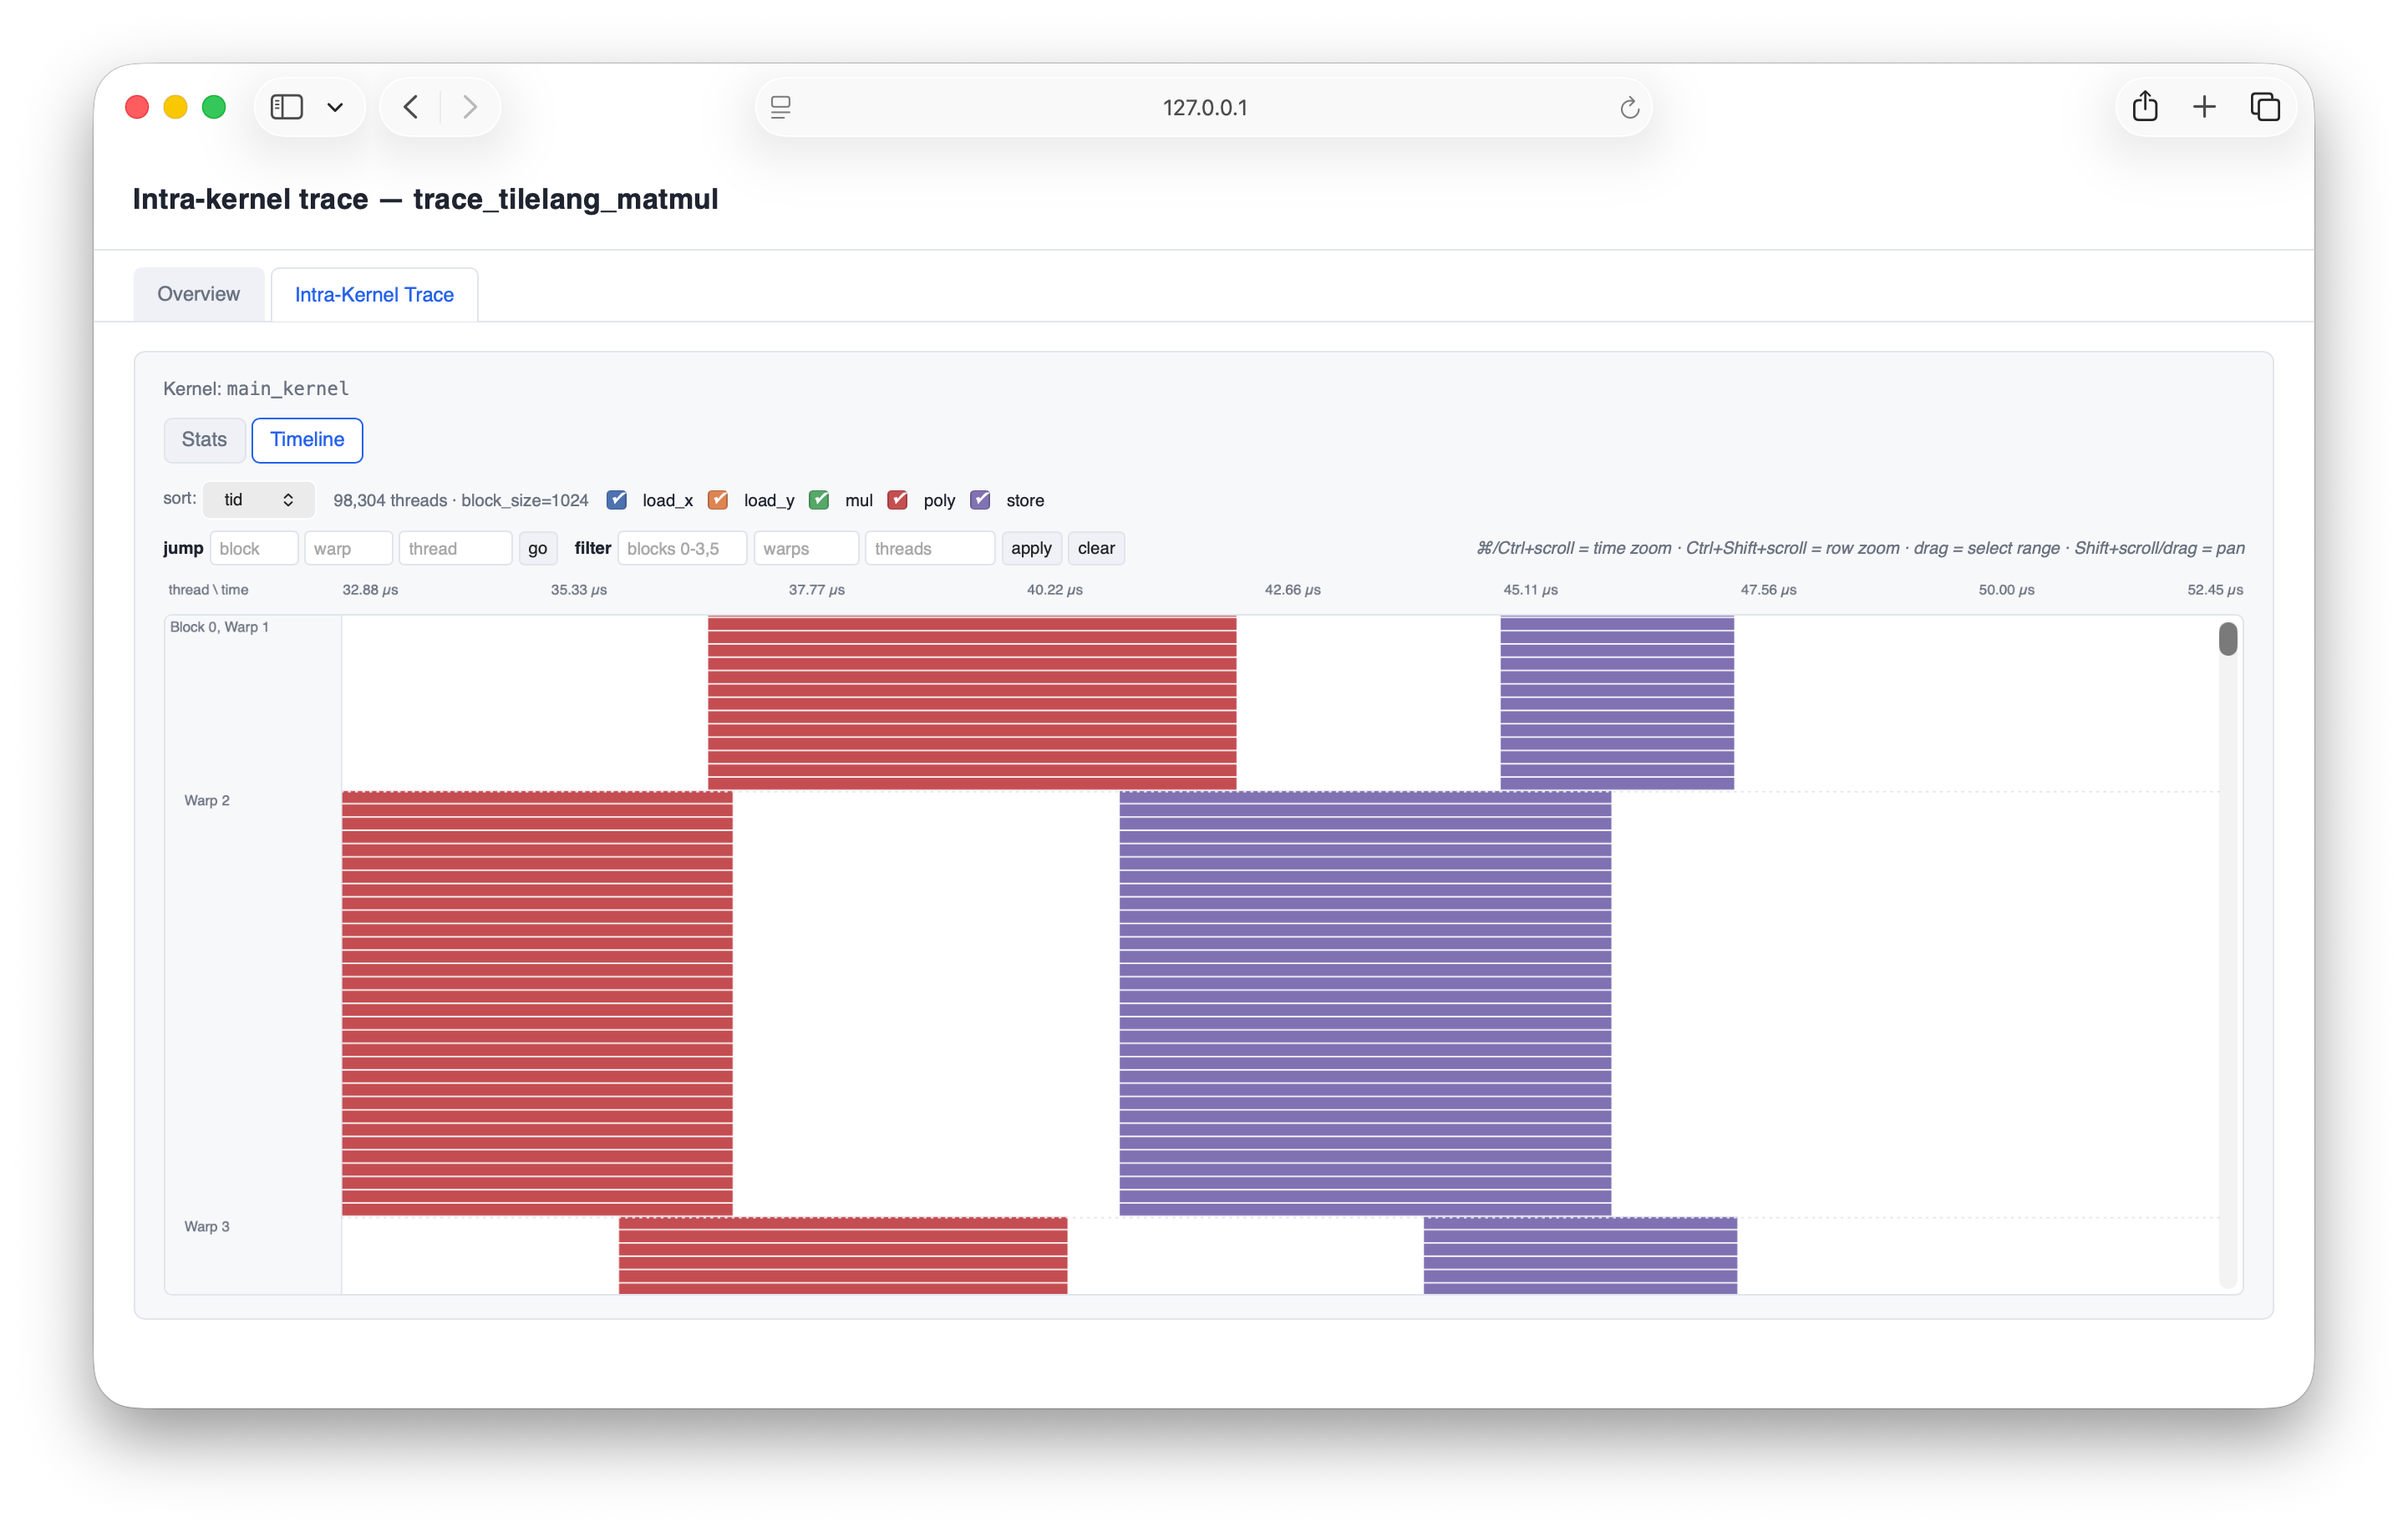
Xtrace records when each phase of a GPU kernel runs. The timeline shows how phases overlap and where the pipeline stalls. Aggregate counters cannot show either.
What a timeline looks like
FlashAttention-4 4.0.0.beta29 on NVIDIA B300 SXM6. batch 2, seqlen 1024, heads 8, head_dim 64. Captured by Xtrace at the SASS level.
CTA 0, the busiest warp of each role. 1 char = 102 ns. Phases shown: 5 of 26.

             0.0                 2.0                 4.1                 6.1                 8.2                 10.2 us
            ┌────────────────────┬───────────────────┬───────────────────┬───────────────────┬───────────────────┐
Producer    │   ██████████████████████████████████████████                                                       │ █ prod.kvload
MMA         │                     ████     ██████   ██████   ███████   ██████    ██████    ███████               │ █ mma.pv_turn
Softmax-A   │                       ███       ██       ███       ██        ██        ██        ██                │ █ sm_a.turn
Softmax-B   │                    ███████   ██████    █████    ██████    ██████    ██████    ██████               │ █ sm_b.turn
Epilogue    │████████████████████████████████████████████████████████████████████████████████████████████████████│ █ epi.tile
└────────────────────────────────────────────────────────────────────────────────────────────────────┘Trace at the SASS level
Xtrace splices its probes into the compiled cubin. The compiler never sees them, so it optimizes the kernel as usual. The trace therefore describes the binary that ships, which gives the highest-fidelity timeline.
SASS-level tracing needs no source and no rebuild. So it also works on closed-source kernels, such as those in cuDNN and cuBLAS. Start with the SASS guide.
Alternative: Trace at source code level
Xtrace can also trace scopes marked in the kernel source. G-Watch turns the markers into probes at the PTX level. This is quick to set up, but the compiler then builds the probes into the kernel. Guides cover CUDA, TileLang, CuTeDSL and Triton.
Read the trace
Every trace renders two ways.
People read the HTML report, an interactive panel.
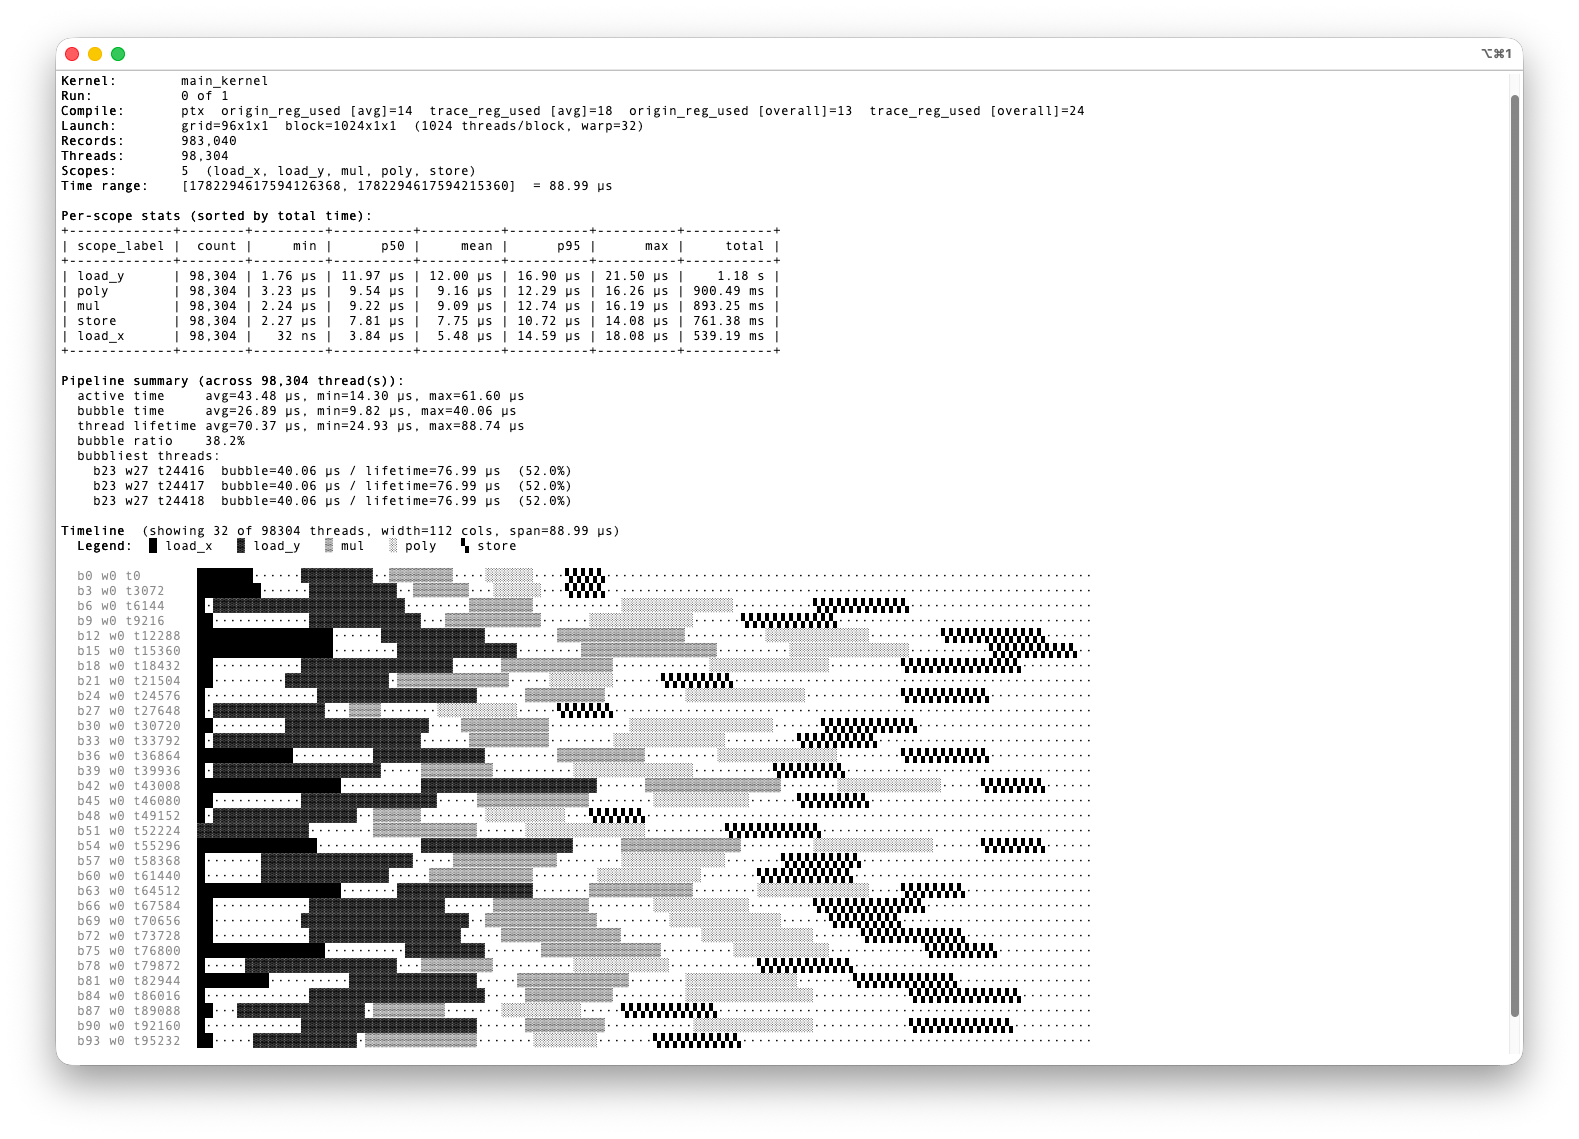
Agents read compact text from
gwatch show.
A region marked in the panel can be copied and pasted to an agent.