Read Xtrace with Your Agent
One trace renders two ways.
The HTML report is an interactive panel for people.
The JSON report is for machines, and gwatch show prints it as text for agents.
A selection token joins the two.
A region marked in the panel becomes a token, and the agent reads that exact region.
Generating Xtrace
Render the traced run to one or both formats. The file extension picks the format.
report.render("trace.html")   # the panel and the stats, one self-contained file
report.render("trace.json")   # the records and the pre-computed analysis block
HTML report
trace.html is a single file with no network dependency.
It opens from disk and can be mailed or attached to a bug.
JSON report
trace.json holds the records and a pre-computed analysis block.
The block has the paired intervals, per-scope percentiles, per-row activity and concurrency.
gwatch show reads this block.
Do not re-derive these numbers from the raw records by hand.
The results look plausible but are often wrong.
For example, an "sm" clock gets read as nanoseconds, or a wrapped ring gets read as an execution count.
Visualize Xtrace
The HTML report
The report has two tabs per traced run.
Trace
Time runs across and rows run down. Each scope has one ink. Overlapping phases blend like layered inks, and idle time stays white.
The rows refine with the zoom level. They go from block to warpgroup, warp and thread. The panel always shows the finest level that still fits.
| gesture | what it does |
|---|---|
| wheel | pan through the rows and along time |
| ⌘/ctrl + wheel | zoom time around the pointer |
| alt + wheel | zoom rows around the pointer |
| double click | reset the view |
| drag the bottom axis | mark a time range |
| drag the left gutter | mark a row range |
| drag the plot | measure along the drag direction |
| shift + drag the plot | measure time |
| middle button or alt + drag | pan |
| right click | copy the marked region (see below) |
Stats
This tab shows how long one run of each region takes and how much it varies. Box strips on a log axis show the spread, grouped by warp role. A table below gives the exact numbers. The axis is logarithmic because a wait and the work it waits on can differ by orders of magnitude.
A region keeps the same ink in both tabs.
Text for agents with gwatch show
gwatch show reads the JSON report and prints the analysis to the terminal.
An agent reads this text directly.
gwatch show trace.json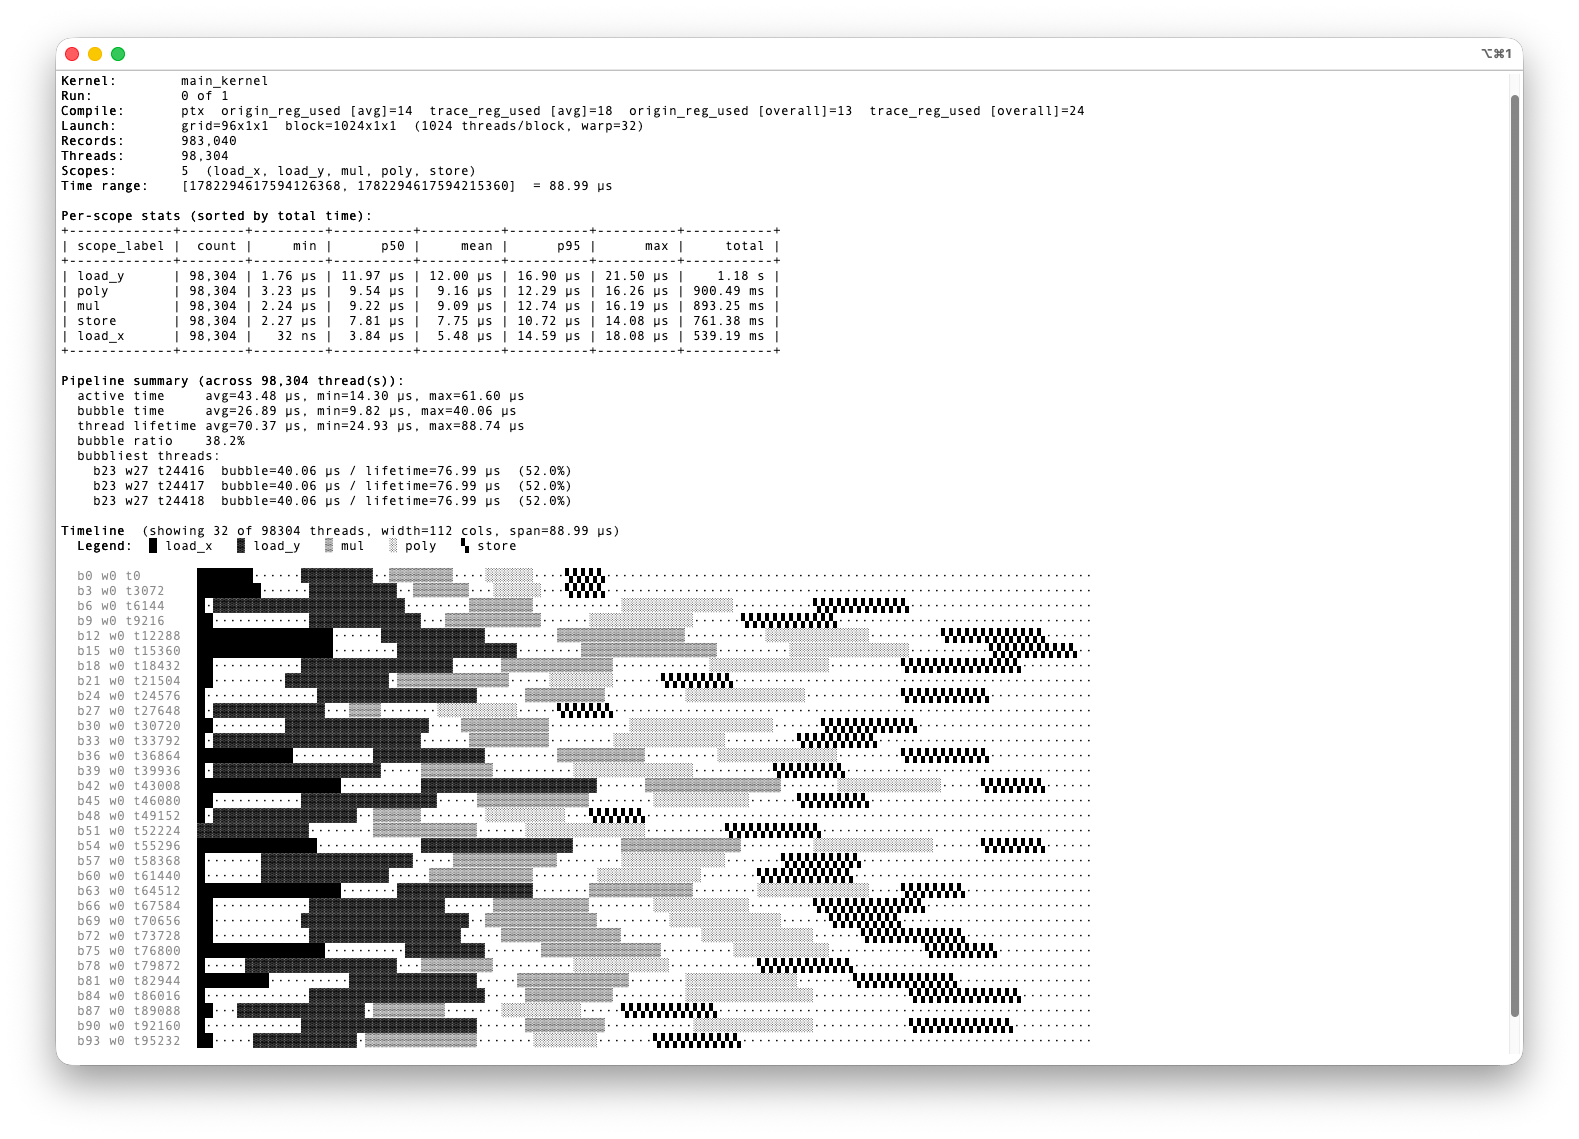
By default it prints four parts:
- a header with the kernel, launch, counts, scopes, clock and time span;
- the per-scope stats;
- the pipeline summary;
- a per-thread ASCII timeline with a legend.
Flags pick a single view:
gwatch show trace.json --stats         # per-scope stats only
gwatch show trace.json --bubbles       # pipeline summary + longest bubbles
gwatch show trace.json --timeline      # per-thread ASCII timeline
gwatch show trace.json --concurrency   # active rows over time
gwatch show trace.json --outliers      # straggler rows
gwatch show trace.json --json          # the full analysis, machine-readable
Filters work with any view:
gwatch show trace.json --block 0-3,5 --stats
gwatch show trace.json --tid '[0,31],[64,95]' --timeline
gwatch show trace.json --stime <t> --etime <t> --bubbles
Hand a selected region to an agent
Mark a region in the panel, then right click:
- Copy selection copies the region as one line.
- Copy as gwatch command copies it as a ready command.
- Clear selection removes the mark.
A copied selection looks like this:
gwtrace/1 kernel=kernel_cutlass_kernel_fl#ef46 t=4365:11462ns lane=block:15-33 order=role scopes=softmax,wait_k_empty
It names the kernel by a short tag. It gives the marked time range and rows. It also lists the scopes inside the region. Paste it to an agent, and the agent reads back exactly that region:
gwatch show trace.json --select 'gwtrace/1 ...' --statsSelection: 19 block(s) → 171 thread(s) · [4365, 11462] = 7.10 µs
Token scopes: softmax, wait_k_empty
...
Two rules keep the token safe to pass around:
- It is checked. The browser and the CLI compute the kernel tag the same way. A token from a different kernel is refused, so the agent never answers about the wrong region.
- Paste it as it is. Row ids in the token count from the grid.
The
--warpflag counts inside a block. Rewriting a token into--tidor--warpby hand selects different rows.
When an agent should ask for one
An agent that only sees aggregates cannot see what the panel shows. A good agent asks instead of guessing:
The aggregate says
wait_k_emptyaverages 1.2 µs, but p95 is 3.2 µs. I cannot tell whether that tail is a few blocks or all of them. Opentrace.htmland find where the copy warps go quiet. Drag out that region, right click → Copy selection, and paste it here.
The G-Watch agent skills teach an agent to ask this way.
They also teach it to read the token through gwatch show.
npx skills add mars-compute-ai/G-Watch -g