Intra-kernel Tracing
Trace the internal phase timeline of a single GPU kernel across CUDA, TileLang, CuTeDSL, and Triton.
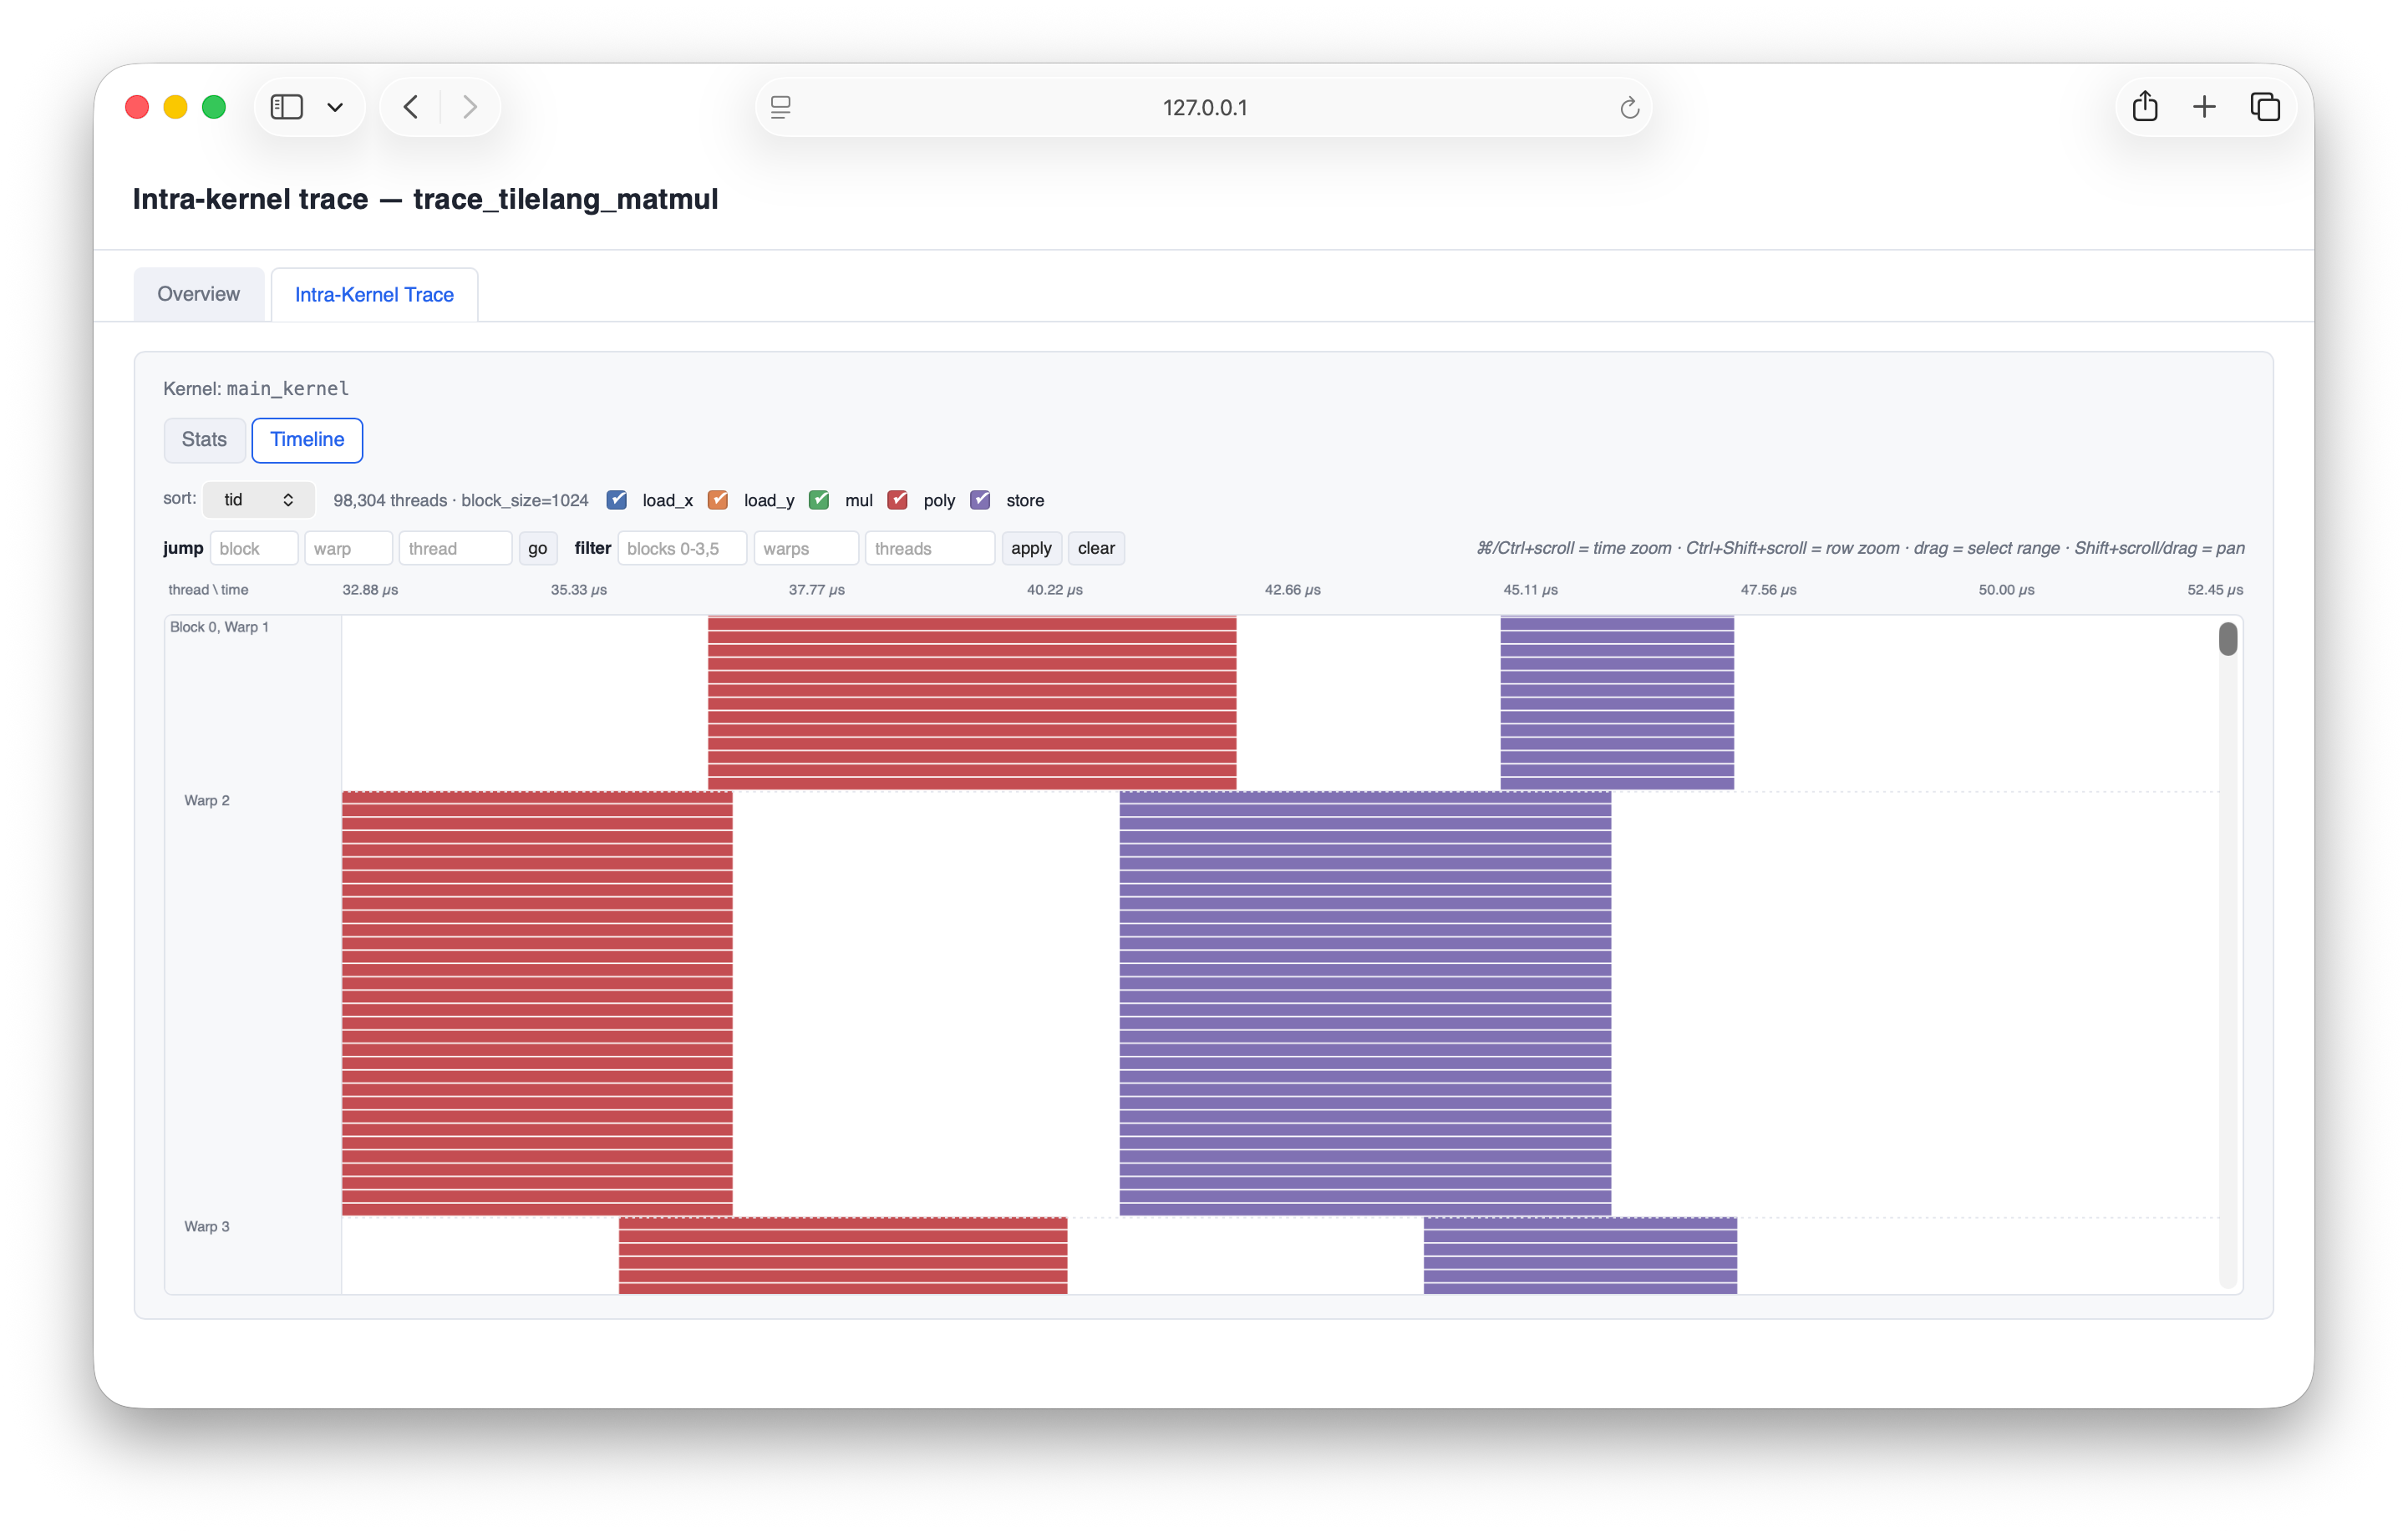
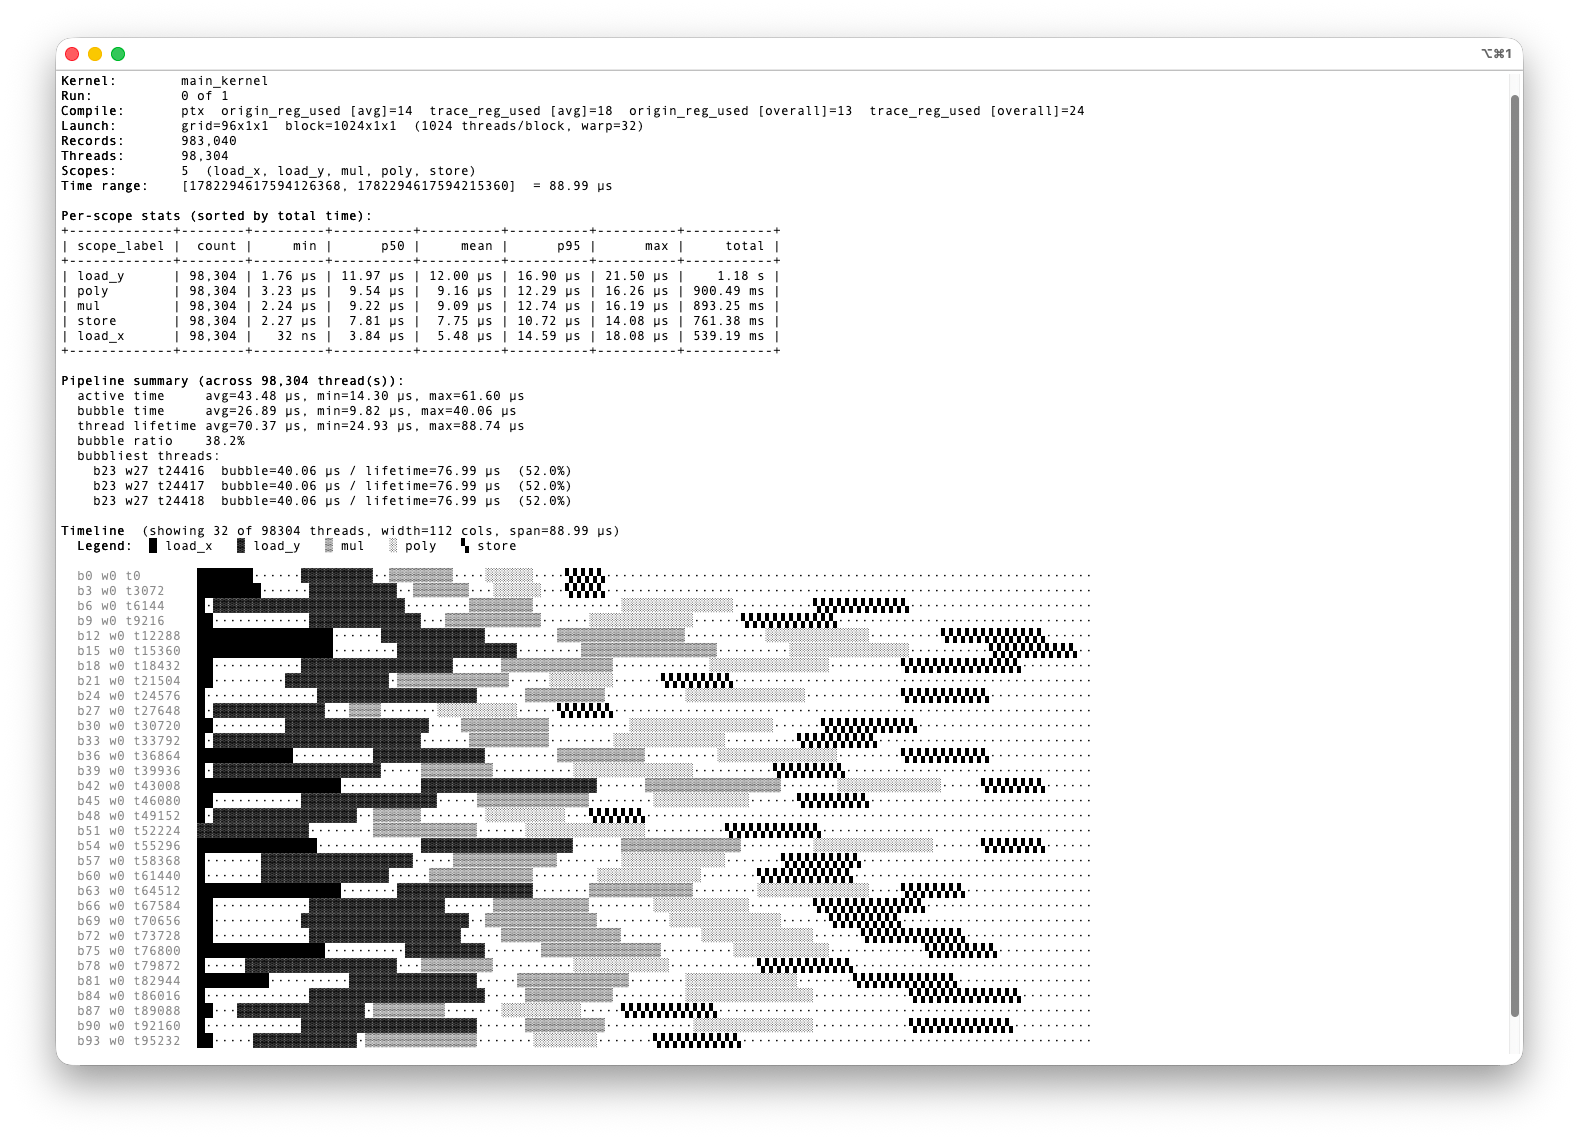
Intra-kernel Tracing (Xtrace) reveals the temporal behavior inside a single kernel invocation: when each phase runs and how they overlap. It exposes pipeline bubbles, synchronization overhead, and warp-role scheduling that aggregate metrics miss. You add device-side scope markers, run the kernel under G-Watch, and get back a per-thread timeline. The same workflow works across multiple kernel DSLs: CUDA, TileLang, CuTeDSL, and Triton.
Every trace renders two ways. The HTML report is a polished, interactive view
for people. The text view is compact and meant for agents, produced by
gwatch show.